Tidy Data
updated: 2022-09-19
Wickham, H. . (2014). Tidy Data. Journal of Statistical Software, 59(10), 1–23. https://doi.org/10.18637/jss.v059.i10
paper
Why should we tidy data?
Many data science projects spent most time on clearning data, e.g., homogenizing data types, removing outliers, imputing missing values, and storing them into a handy and convinient database. The clearning is not once-in-a-project process but must be repeated over the couse of analysis. One study shows that 80% of data analysis is devoted for data clearning and preparations paper. Having a tidy dataset lets us focus on more interesting problem, rather than focusing on uninteresting work of data clearning.
What is Tidy data?
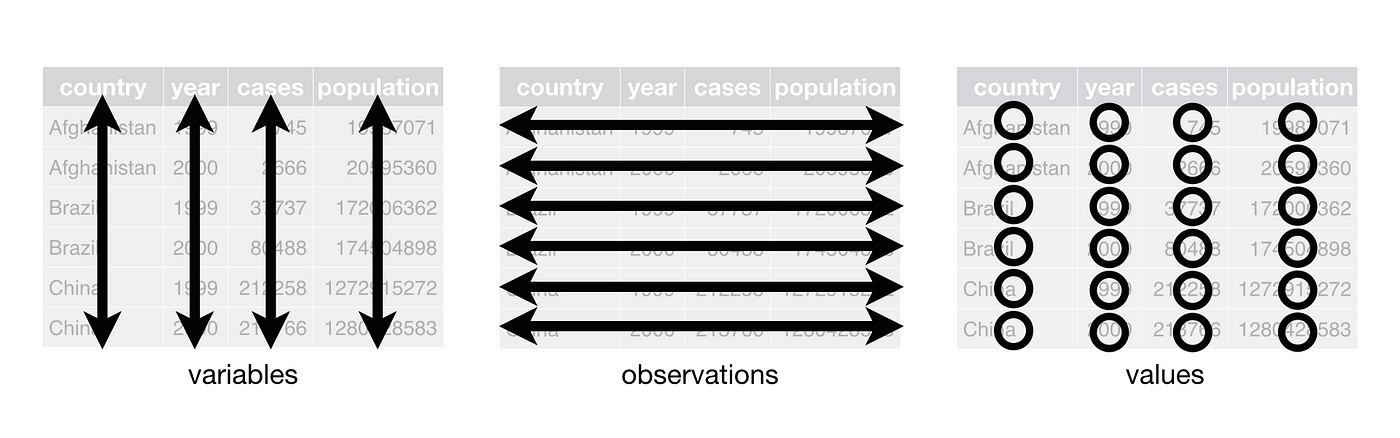
Tidy data is a set of guidlines on how to structure data and its semantics. In tidy data, a dataset is a collection of values. Every value belongs to a variable and an observation. A variable contains all values of the same attribute across different observational unit. An observation contains all variables of different attributes for the same observational unit.
For example, consider journal impact factors of four journals in three years.
| Journal | 2019 | 2020 | 2021 |
|---|---|---|---|
| Physical Review E | 3 | 3.2 | 4 |
| Nature Physics | 5 | 6 | 7.2 |
| Nature | 12 | 18 | 30 |
| Science | 11 | 19 | 32 |
The columns include years 2019-2021, which are the attributes of the observation unit (i.e., journals). Thus, they should be treated as variables. We can restructure the table as
| Journal | Year | Journal Impact Factor |
|---|---|---|
| Physical Review E | 2019 | 3 |
| Physical Review E | 2020 | 3.2 |
| Physical Review E | 2021 | 4 |
| Nature Physics | 2019 | 5 |
We consider Journal Impact Factor as a variable. If we have another Impact factor, like immediacy index, we may better treat the type of metrics as a variable, i.e.,
| Journal | Year | Citation Index | Index |
|---|---|---|---|
| Physical Review E | 2019 | Journal Impact Factor | 3 |
| Physical Review E | 2020 | Journal Impact Factor | 3.2 |
| Physical Review E | 2021 | Journal Impact Factor | 4 |
| Physical Review E | 2019 | Immediacy index | 2 |
There is no definite rule to draw a line between variables and observations. A rule-of-thumb is whether it is easy to consider a functional relationships between variables, and it is easier to make comparisons between groups of observations.
Tidy data compose the dataset based on the following three principles:
- Every column is a variable
- Every row is an observation
- Every cell is a value
Why tidy data?
The data analysis is an exploratory process. The goal of the analysis often changes through the course of the project. New variables may be added, or a different level of observational units may become an interest. Thus a good dataset needs to be flexible, efficient, and convinient for different lines of inequaries.
In tidy data, every dataset is organized in a standard fasion, which helps people to understand the organization of the data. The data structure is robust against the addition of variables. No structural changes are needed. It is also efficient, e.g., one can extract a set of data samples in a particular category by filtering by the categorical variable.